TechnologyInternal Technology — Core technology that powers the products. Not sold separately.

Built beneath every decision.

Internal technology, not sold separately.

Systematic trading

  1. Data

    Alpha Data Engine

  2. Research

    Strategy Discovery

  3. Risk

    Trading runtime & risk

  4. Execution

    Freqtrade

  5. Evidence

    Performance

Shared engineering rules — separate data path

Investment Intelligence

  1. Data

    Market, fundamental and filing data

  2. Analysis

    Market, security and portfolio engines

  3. Product

    Investment Intelligence

Investment Intelligence collects its own data and follows the same rules. It does not yet run on the Alpha Data Engine.

Four disciplines.

Each one designed in, not added afterwards.

Data

Raw observations kept unchanged, versioned, checked for gaps and staleness — and replayed using only what was available at the time.

Research

Turning information into complete, testable candidates. Judged by what survives execution-level validation, not by the number of experiments.

Risk

Sizing, stops, portfolio limits and circuit breakers designed into the system, not added afterwards.

Execution

The execution engine gives the verdict: dry run before capital, and results recorded by evidence class.

Source and age, first.

Every Investment Intelligence analysis states when each input was last updated, and flags what is stale, before any conclusion.
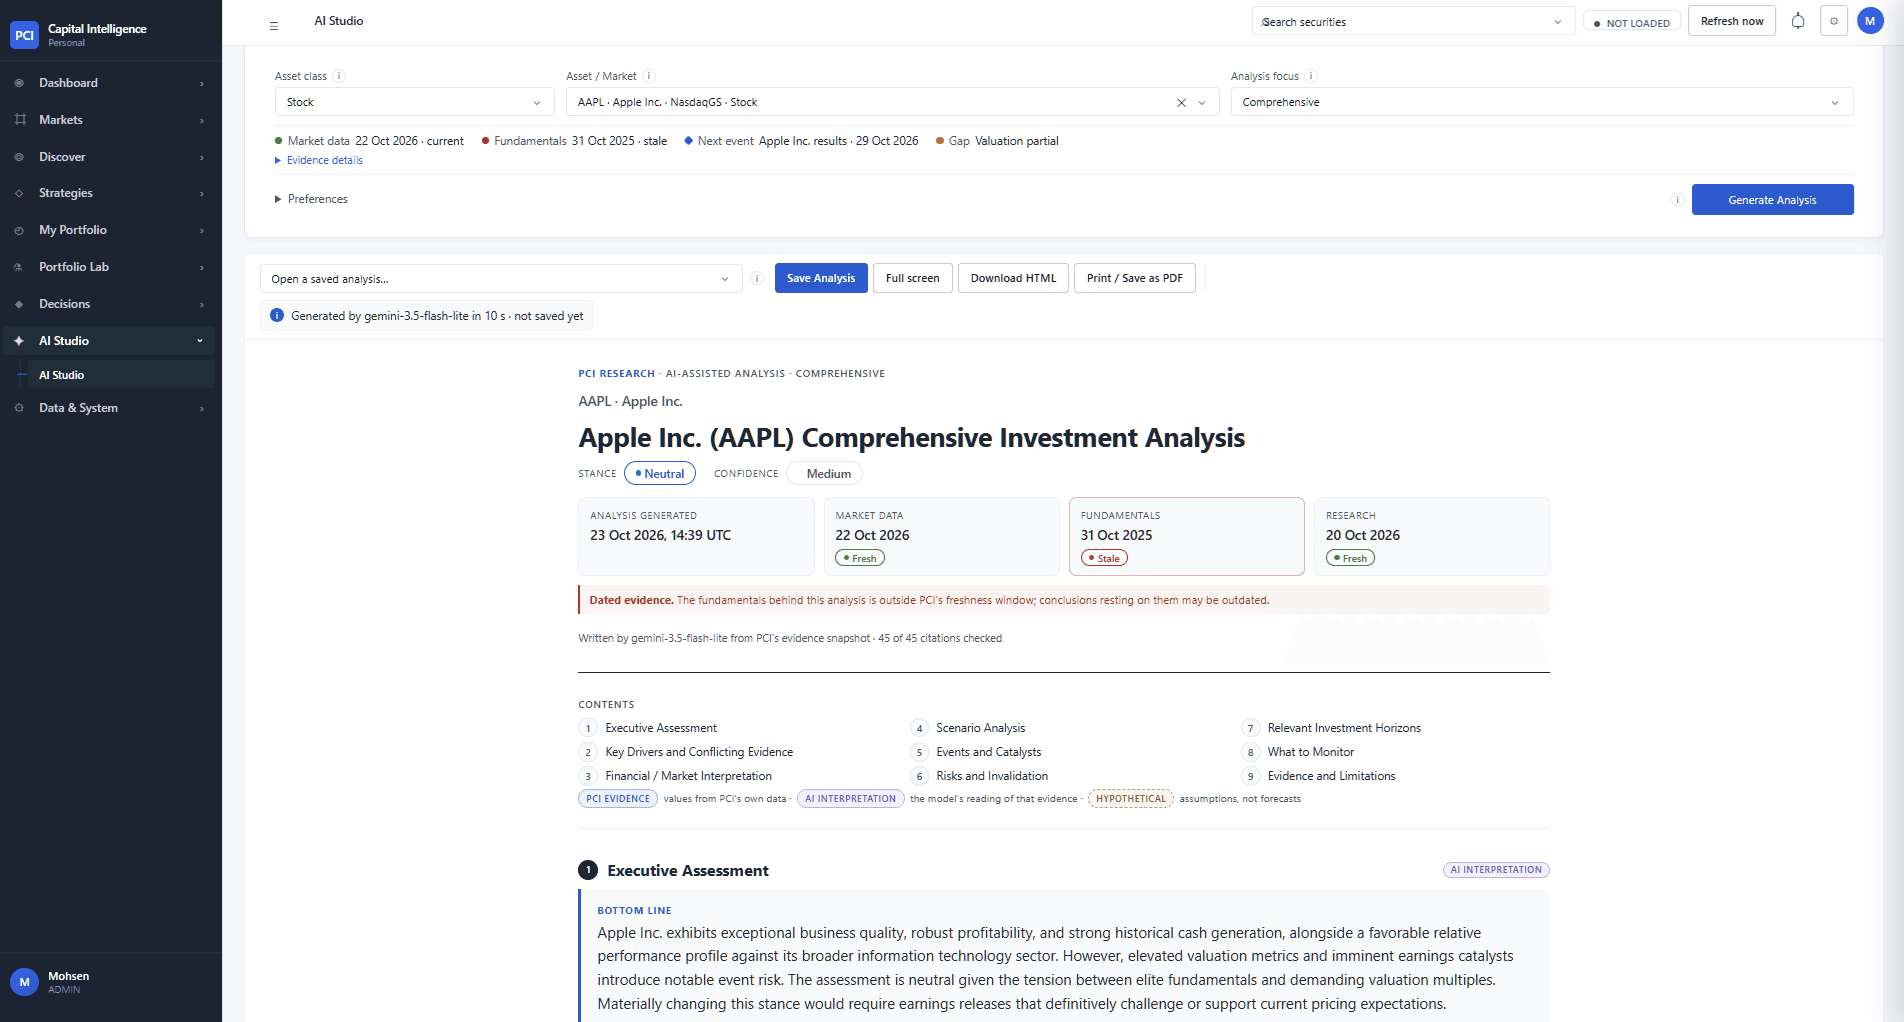
Detail of an AI Studio report header: the analysis time, then market data, fundamentals and research each dated and marked fresh or stale, with a warning that the fundamentals are outside PCI's freshness window.

Interested in the private beta?

Investment Intelligence is in an invitation-only beta for a small number of evaluators.
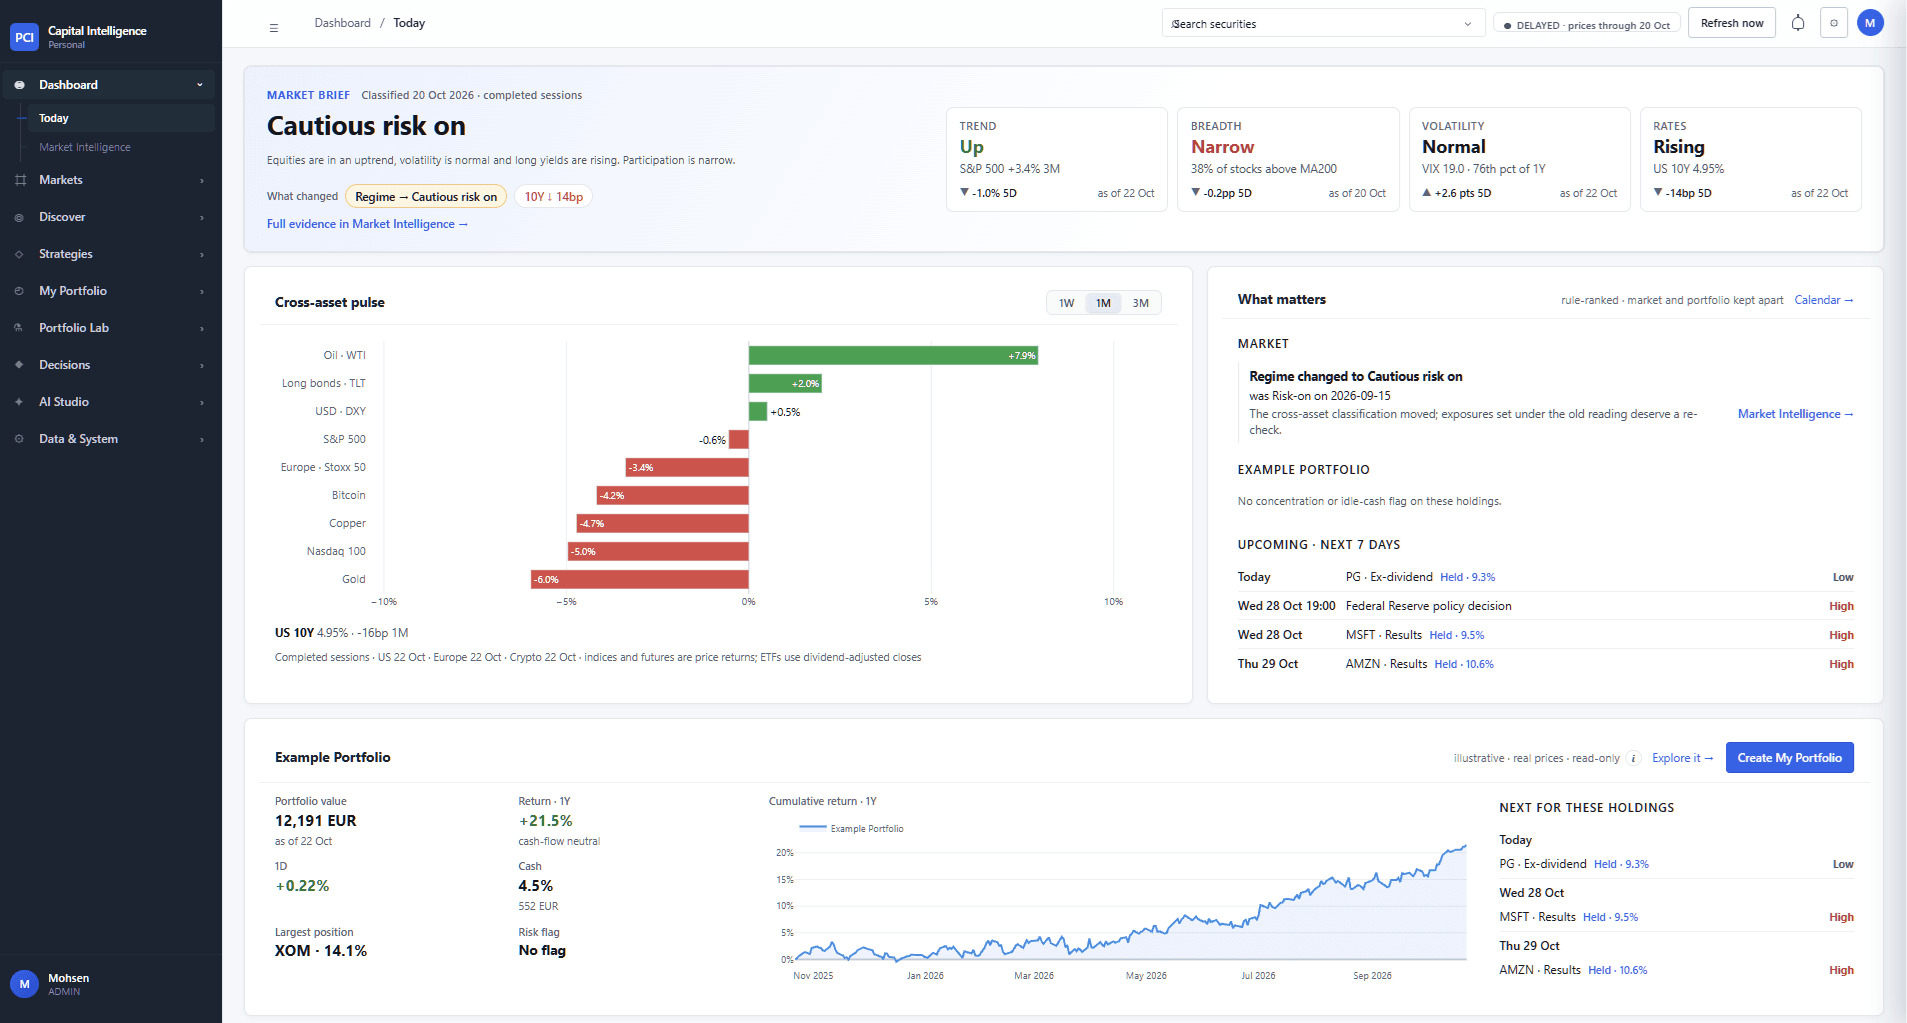
Detail of the Today dashboard: a market brief classifying the session as cautious risk on, with what changed since the last reading, above a cross-asset pulse of one-month returns from oil and long bonds to gold.
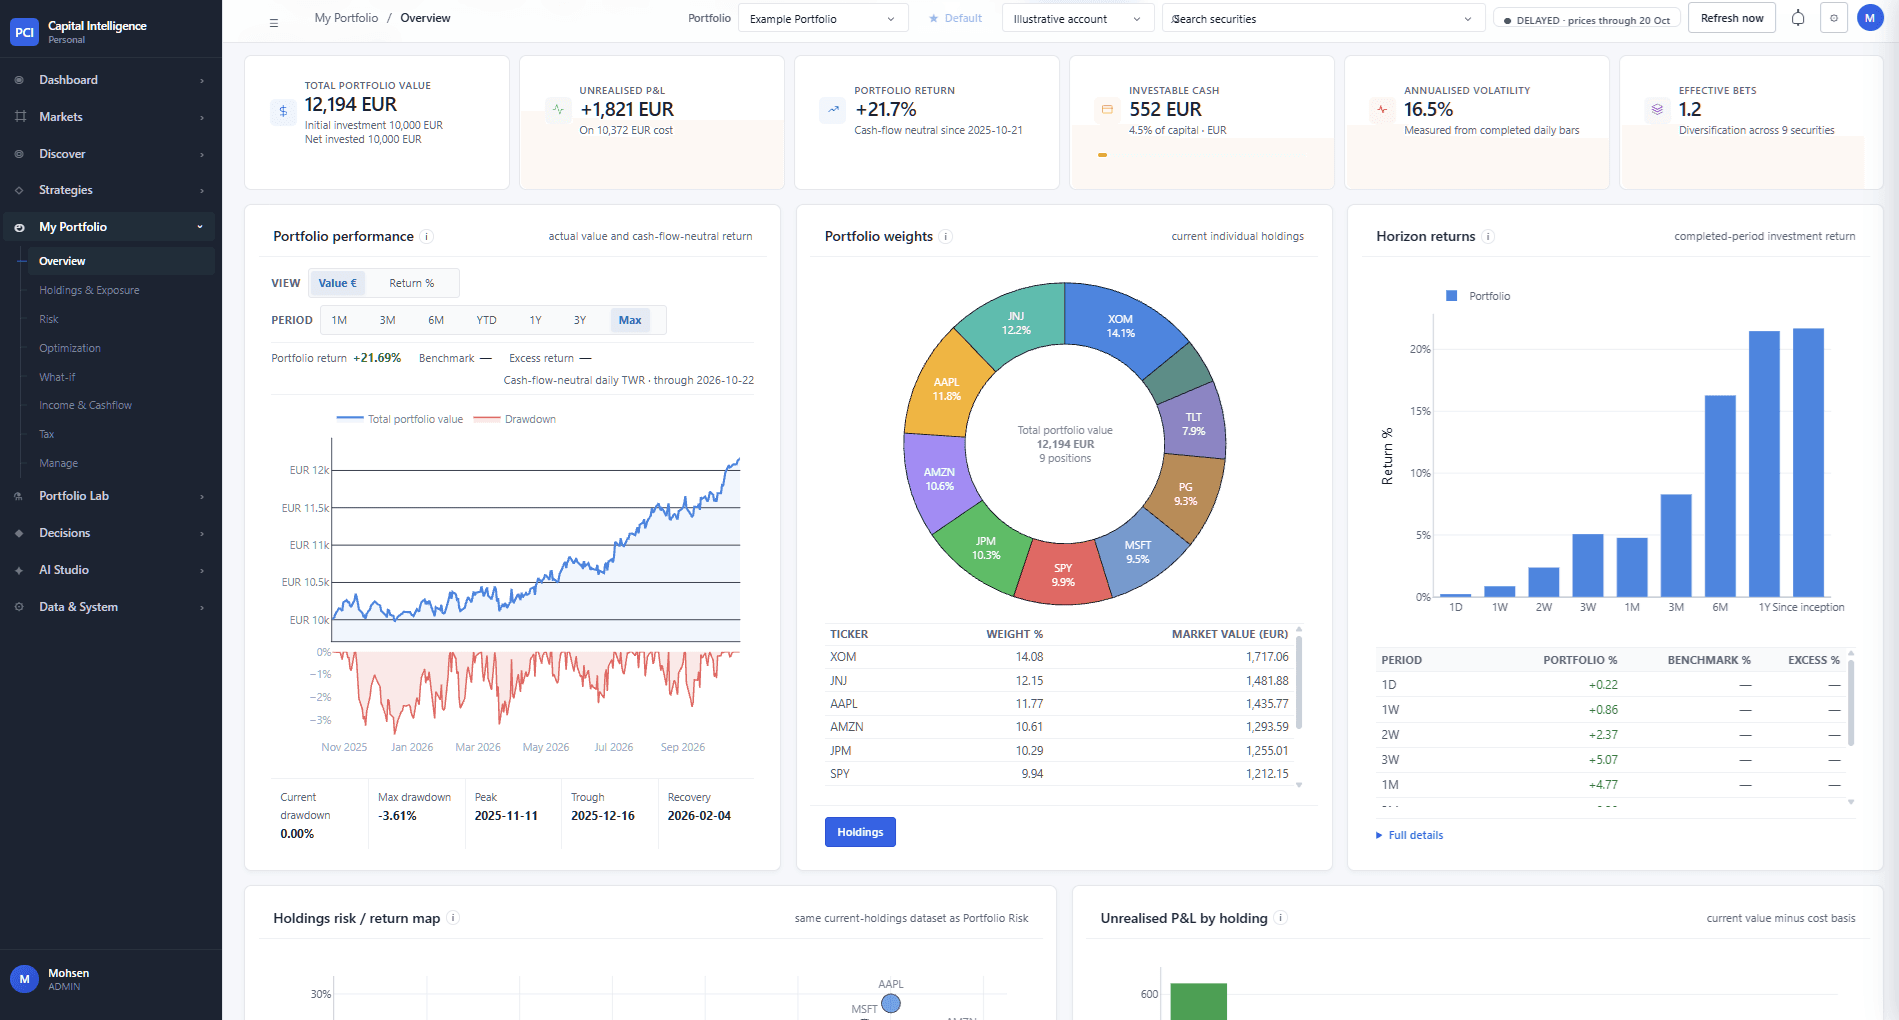
Detail of the example portfolio: portfolio value over time with its drawdown plotted beneath and drawdown, peak, trough and recovery listed under the chart, beside the current weights of each holding.